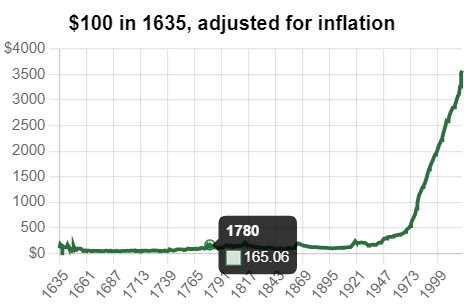
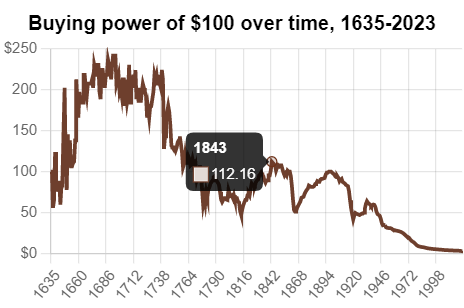
Ian Webster is a NASA and Google trained data engineer who was frustrated by the lack of clear information around economic indicators. In response to this challenge, he has created a free public resource that tracks inflation trends back to the year 1635. This is more than a thorough analysis, and the tools they have built are robust. One interesting insight is that certain cities experience higher inflation than others with San Diego, Seattle, Denver, and San Francisco topping the list.
Part of our job as financial planners and investment managers is to take the vast amounts of financial information and identify the specific signals out of the noise that matter to each client. Inflation has ranged from 2.04% in St. Louis to 3.4% in San Diego from 1990 to 2020. Both numbers appear mild, and yet just like investment returns, inflation rates cumulatively compound.
Much of the stress in the corporate earnings world today is tied to quick spikes in inflation data and the concern that if inflation exists for too long it will wipe out the earnings gains. This could undermine the value or price of the assets that the collective investment community owns.
