



Change, Change, Change
Happy 250 USA! As our republic pushes ever forward and navigates the changing geopolitical landscape, we thought it would be a good time to look at change through our lens as investment managers, financial planners, and advisors. Historically, the periods of greatest structural transformation are precisely when a disciplined, time-tested foundation matters most.
“Chain, Chain, Chain” was the timeless refrain from Aretha Franklin’s hit song “Chain of Fools” from 1967. If you want a quick throwback, here is a live old link to the song. It has an infectious and easy-to-remember vibe to go along with some striking lyrics that hit on the challenges of being in a bad relationship, which is exactly what it can feel like for investors from time to time. The chains of past decisions can make it harder to change or even know what to change. Right now, the broader market is in danger of falling in love with a singular narrative, binding its future to a remarkably small group of heavily hyped companies.
What Is Changing Right Now?
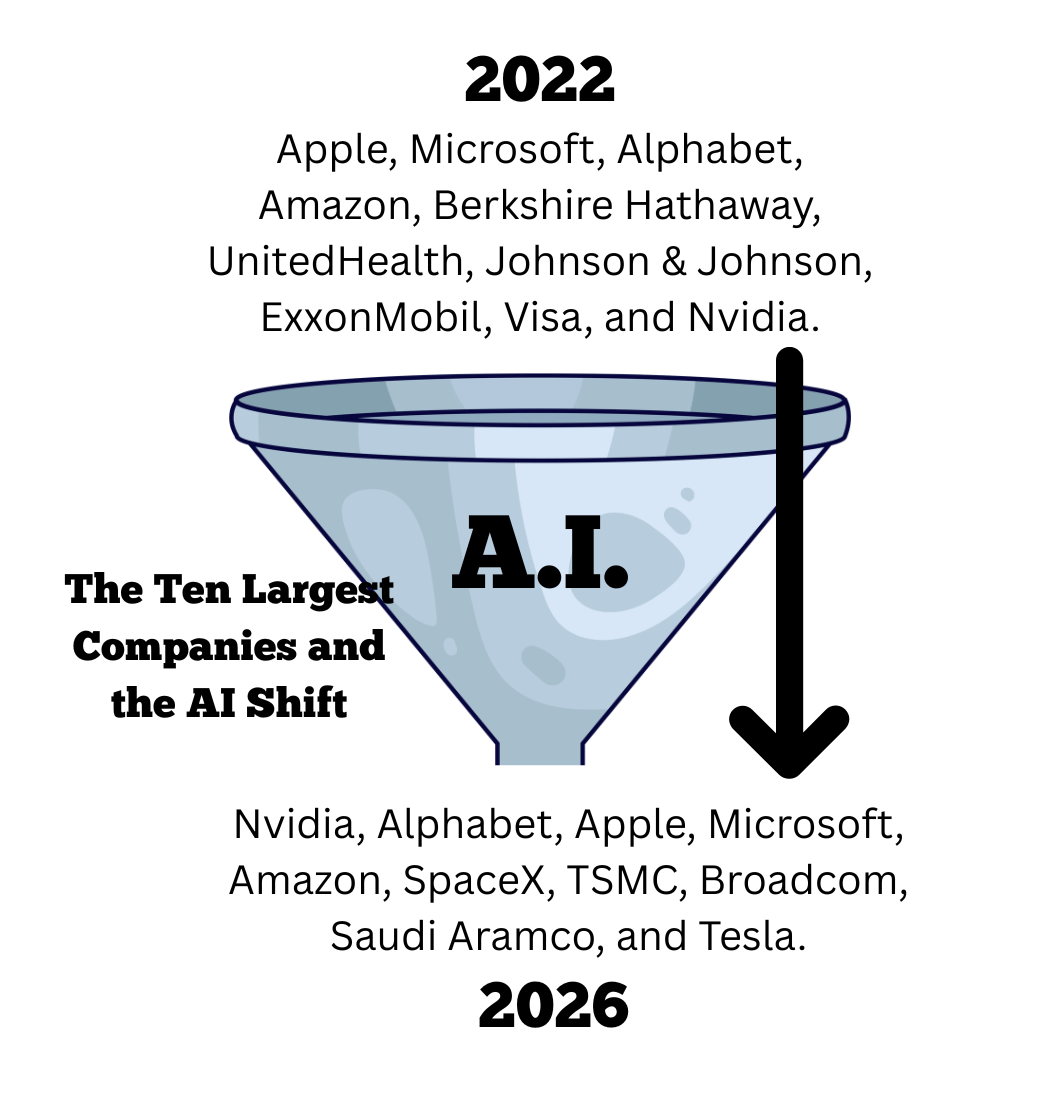
The ten largest companies in the world as of the fall of 2022 were Apple, Microsoft, Alphabet, Amazon, Berkshire Hathaway, UnitedHealth, Johnson & Johnson, ExxonMobil, Visa, and Nvidia. They had a combined market capitalization of roughly $11.3 trillion, representing roughly 22% of the total S&P 500 index. The dominant concerns of 2022 centered around aggressive Federal Reserve interest rate hikes, generational inflation spikes, and a broad valuation correction across the technology sector. The P/E multiple for the group averaged 30, with a high of 75 for Amazon and a low of 8 for Exxon.
Then, in November of 2022, OpenAI released ChatGPT to the world, and corporate boardrooms immediately began discussing the threats and opportunities the breakthrough technology posed. Three and a half years later, the composition of the 10 largest companies in the world and their financial characteristics have materially changed.
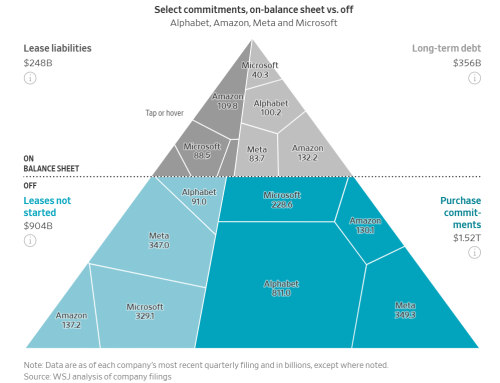
At a glance, it is clear that capital allocation to the AI opportunity is massive, and the corresponding economic returns from these investments remain unclear. The names of the 10 largest companies have shifted. The roster of these ten market leaders now includes Nvidia, Alphabet, Apple, Microsoft, Amazon, SpaceX, TSMC, Broadcom, Saudi Aramco, and Tesla. Even though SpaceX is not in the S&P index yet, the remaining companies are represented in the index, and the concentration has intensified dramatically, with the top ten holdings now commanding a staggering 41% of the index’s weight and trading at an average P/E multiple of over 67x.
Digging a little deeper with a disciplined research process is part of our corporate mission at DLK and this is where it gets interesting. Where are the quality investments amidst the spending and betting on AI? Which companies are allocating capital prudently and which ones are betting the house?
When we ask the right questions and look past the price of a stock, certain trends emerge. It becomes clear which companies are right for a speculative investor focused on trading in and out of a company, and which are right for a long-term investor with a 3-to-5-year horizon for ownership.
To illustrate this divergence in investor time horizons and risk profiles, let’s look at how the public markets value an established, highly liquid technology giant like Google alongside a high-growth, newly public market leader like SpaceX.
Opinions Change Faster than Earnings
As the largest companies began adjusting their spending, the investment analysis community began examining potential positive and negative outcomes, and the software industry immediately felt the impact. The predictability of future earnings for these companies, which was once considered impenetrable, was called into question. How were they going to survive this technological change? The outcome remains to be seen, but the court of public opinion moved swiftly.
It is often suggested that the P/E ratio of a stock is a measure of how many years into the future you are paying for at that moment. The long-term average for the largest companies in the US has ranged from 17 to 22, depending on their size. Therefore, when you pay 30 times current earnings for a company and some negative news comes about the company or its industry, you can easily see it drop by over 30% to just get back to the long-term average. This is often expressed by saying the stock trades at a premium (to either its peers or to the market) which can be earned due to its position in its industry.